Top 10 Economic Indicators for Investors
Discover trading and investment basics tailored for Indian retail investors. Elevate your financial skills with expert tips and practical education. Start learning now!

Introduction
Why Economic Indicators Matter
Understanding the pulse of the market is crucial for any investor wanting to make sound decisions. Relying solely on stock prices or media headlines can leave traders exposed to unseen risks and unexpected volatility. Economic indicators serve as the foundational signals that reflect the underlying health of an economy, and by extension, can strongly influence the performance of stocks, bonds, and other investment vehicles.
For example, when the U.S. Bureau of Labor Statistics released the April 2023 jobs report, the addition of 253,000 jobs surprised many analysts and led to a surge in the S&P 500, as investors read the data as a sign of economic resilience. Seasoned investors, like those following Warren Buffett’s portfolio movements, frequently reference these key data points to spot trends, adjust positions, or hedge risks more effectively.
What This Guide Covers
Navigating the landscape of economic data can be overwhelming. This guide breaks down the top 10 most influential economic indicators that every retail investor and beginner trader should track. It’s designed to demystify each indicator with clear explanations and actionable tips geared toward the needs of individual traders—especially those interested in the U.S. and Indian markets.
Readers will learn what each indicator measures, how to interpret recent data, and why it matters for investment strategy. For instance, interpreting India’s Consumer Price Index (CPI) revealed why the Reserve Bank of India paused interest rate hikes in mid-2023, affecting stocks like HDFC Bank and ITC. Real-world scenarios help bridge the gap between theory and application, making this guide valuable for those just starting their investing journey as well as those seeking to sharpen their analytical edge.
Gross Domestic Product (GDP)
Overview
Gross Domestic Product (GDP) stands out as the backbone when assessing a country’s economic status. It captures the total monetary value of all finished goods and services produced within a nation’s borders over a specified period, typically every quarter or year.
For example, when the U.S. reports a GDP of $25.5 trillion for 2022, that figure sums up activity spanning from a Tesla Model Y manufactured in California to legal fees generated by firms in New York. According to Investopedia's guide on top economic indicators, consumer spending—encompassing everything from retail shopping at Walmart to entertainment subscriptions—accounts for over two-thirds of U.S. GDP.
Key Details
The Bureau of Economic Analysis (BEA) is the authoritative source releasing GDP data in the United States. These reports arrive quarterly, providing critical insight for investors and policymakers alike.
GDP growth—such as the 2.7% annualized increase in Q1 2023—signals an expanding economy, often boosting market sentiment. Conversely, negative growth as seen during the 2020 pandemic (-3.5% for the full year) may indicate a contraction and can trigger selloffs in stock markets.
What Makes It Special
Few economic metrics offer a panoramic view of national performance like GDP. It aggregates contributions from all sectors, making it the gold standard for determining economic health.
Major decisions, from Federal Reserve rate changes to multinational investment strategies, often hinge on GDP figures since they reflect the economy’s overall trajectory.
Considerations
GDP is inherently backward-looking, summarizing past activity rather than predicting future trends. Analysts must wait for quarterly reports, making real-time guidance challenging.
Frequent revisions are part of the process. For instance, the BEA may initially estimate GDP growth at 1.9%, only to adjust it to 2.2% once more comprehensive data becomes available.
Best For
Broad trend analysis relies on GDP, especially when tracking economic cycles or structural shifts. For example, long-term investors often analyze multi-year GDP patterns to inform asset allocation strategies.
Equity strategists and mutual fund managers may use GDP data when planning for shifts in portfolio exposure, particularly when anticipating prolonged expansions or recessions.
Additional Info
Market participants actively monitor each iteration of GDP releases—labeled “advance,” “preliminary,” and “final.” The “advance” release is particularly watched due to its potential to move currency and equity markets. For instance, an unexpectedly high advance GDP report has historically resulted in a surge in the S&P 500 index, as investors price in stronger growth prospects.
Discrepancies between these releases are common, so it’s prudent for analysts to adjust expectations as new data refines the economic picture.
Unemployment Rate
-2025-12-12T11-34-12-574Z.jpg)
Unemployment Rate
Overview
The unemployment rate is a core economic metric, reflecting the percentage of people in the labor force who are jobless and actively seeking employment. It serves as a barometer for the overall health of a nation’s job market and can influence everything from consumer confidence to central bank policy.
For example, during April 2020 amid the COVID-19 pandemic, the U.S. unemployment rate soared to 14.7%, highlighting dramatic shifts in economic stability and prompting significant government interventions, such as stimulus packages and expanded unemployment benefits.
Key Details
The U.S. Bureau of Labor Statistics (BLS) releases the unemployment report monthly, providing timely insights that traders and investors watch closely. This report includes the widely cited U3 rate, which covers those actively seeking work, and the broader U6 rate, which incorporates discouraged workers and part-timers seeking full-time jobs.
For example, in September 2023, the U3 rate stood at 3.8% while the U6 rate, capturing underemployment, was notably higher at 7.0%. This difference provides a fuller picture of the labor market’s true condition.
What Makes It Special
Changes in the unemployment rate are closely linked to consumer spending power and the economy’s ability to withstand shocks. When jobs are plentiful, Americans tend to spend more, bolstering corporate revenues and equity markets.
After the Great Recession, a steady decline in unemployment rates from 10% in 2009 to below 4% by 2019 reflected a robust recovery and underpinned a prolonged U.S. stock bull market. Retailers like Walmart and Amazon reported strong sales in these periods, correlating with higher employment and disposable income.
Considerations
It’s important to note that the unemployment rate can be influenced by changes in labor force participation. When more individuals stop looking for work, the rate may fall even if job creation stalls.
For instance, the aftermath of the pandemic saw labor force participation in the U.S. drop from 63.4% in February 2020 to 61.4% by January 2021, impacting the reliability of unemployment figures as a stand-alone gauge.
Best For
Retail investors and traders often monitor unemployment data to assess the vitality of the consumer sector and determine optimal timing for equity investments. Shifts in employment levels can hint at underlying trends in sectors like retail, hospitality, and manufacturing.
Stock indices such as the S&P 500 frequently react to unexpected changes in the unemployment rate, offering trading opportunities for those who track these economic releases closely.
Additional Info
Analysts frequently examine the unemployment rate in tandem with job creation figures—such as non-farm payrolls—to grasp labor market dynamics comprehensively. These data points combined can clarify whether changes in the headline number stem from true job gains or shifts in participation.
For example, in June 2023, the U.S. added 209,000 jobs while the unemployment rate stayed at 3.6%, suggesting robust job growth and labor market resilience.
Reference: Civilian unemployment rate
Consumer Price Index (CPI)
-2025-12-12T11-34-12-575Z.jpg)
Consumer Price Index (CPI)
Overview
The Consumer Price Index (CPI) serves as a key economic indicator by tracking shifts in the retail prices of a representative basket of goods and services over time. This basket typically includes housing, apparel, transportation, medical care, and more, reflecting real purchasing patterns at the consumer level.
Monitoring CPI gives investors and market watchers a frequent snapshot of how everyday expenses fluctuate, providing essential insight into price stability or volatility in the U.S. economy.
Key Details
Published each month by the U.S. Bureau of Labor Statistics (BLS), the CPI is widely regarded as the principal measure for U.S. inflation. Investors, analysts, and policy makers rely heavily on this report to judge the pace and scale of inflationary trends. For instance, dramatic increases in the CPI during early 2022 prompted the Federal Reserve to escalate interest rates in an effort to rein in inflation.
As highlighted in the Top 10 U.S. Economic Indicators, CPI remains central to evaluating price movement and setting monetary policy.
What Makes It Special
The CPI’s direct influence extends well beyond surface-level economics. Changes in CPI can have immediate effects on consumer purchasing power; as prices climb, each dollar buys less. Policymakers use CPI shifts to guide interest rate decisions, which in turn shape borrowing costs and the pricing of financial assets.
For instance, U.S. Treasury bond yields often spike following unexpectedly high CPI reports, while the S&P 500 index may experience increased volatility as investors reassess inflation risks and growth expectations.
Considerations
While CPI is a valuable tool, its figures can show significant volatility, particularly due to fluctuating food and energy prices. Economists often turn to the 'core CPI'—which excludes these two components—to gauge underlying inflation trends without short-term shocks skewing the data.
The surge in gasoline prices following supply disruptions in 2022 provided a clear example: headline CPI spiked, while core CPI reflected steadier underlying trends. Awareness of these differences is crucial when interpreting monthly releases.
Best For
Retail investors and traders use CPI trends to assess potential inflation risks and determine when to adjust portfolios. For example, during periods of rising CPI, investors may shift holdings to inflation-protected assets like Treasury Inflation-Protected Securities (TIPS) or re-balance allocations toward sectors less sensitive to inflation, such as utilities or healthcare.
Many intermediate traders monitor CPI as a trigger for changes in equity exposure or as a gauge for timing purchases of risk-sensitive assets.
Additional Info
It’s important for investors to distinguish between 'headline' and 'core' CPI data when evaluating economic health or preparing for potential market moves. While headline CPI captures the total inflation picture, core CPI offers clearer insight into sustained inflationary pressures.
Comparing both figures provides a more nuanced understanding of the forces at play in the broader economy and helps refine decision-making for both short- and long-term investment strategies.
Reference: CPI Home : U.S. Bureau of Labor Statistics
Producer Price Index (PPI)
Producer Price Index (PPI)
Overview
The Producer Price Index (PPI) serves as a crucial metric for understanding inflation dynamics in the economy. It measures fluctuations in the average selling prices that domestic producers receive for their goods and services over time, providing early insights into cost pressures before products reach consumers.
PPI tracks price changes at various stages of production, from raw materials like steel and oil to finished products such as automobiles. For example, when the cost of crude oil spikes, PPI often reflects these shifts quickly, foreshadowing potential increases in gasoline and transportation expenses across the broader economy.
Key Details
The Bureau of Labor Statistics (BLS) issues the PPI report monthly, making it a timely resource for market participants. Each release offers a snapshot of wholesale price trends across more than 10,000 product categories in the U.S. economy.
In March 2023, the BLS reported a 0.4% rise in PPI for final demand, which immediately prompted analysts at Goldman Sachs to revise their inflation projections—highlighting how updates can impact financial decision-making and economic outlooks.
What Makes It Special
PPI is widely recognized as an early signal of inflation, especially at upstream production levels. It detects cost changes before they are passed on to retail prices, giving policymakers and traders a lead indicator on broader inflation trends.
During 2021, surges in PPI for lumber and construction materials warned of future increases in housing costs, months before those trends showed up in the Consumer Price Index (CPI).
Considerations
While PPI offers predictive power, it is also renowned for volatility due to fluctuations in commodities and manufacturing supply chains. This volatility means that short-term spikes or dips often require further analysis to interpret underlying economic conditions.
Investors noticed in April 2022 when a sharp increase in PPI signaled supply constraints at U.S. auto manufacturers, later leading to higher vehicle prices in the CPI and broader inflationary ripple effects.
Best For
PPI is particularly valuable for those monitoring inflation-sensitive investments, such as Treasury Inflation-Protected Securities (TIPS) or commodities. Professional investors often leverage PPI trends as an early warning system for portfolio adjustments.
For instance, BlackRock’s fixed-income strategists cite PPI readings in their monthly outlook to manage bond portfolio risks during periods of anticipated inflation swings.
Additional Info
The index covers a wide range of economic activity, including goods, services, and even construction. This broad base allows analysts to pinpoint supply-side inflation in sectors that the CPI might overlook.
Real-world application can be seen when analysts examine PPI data on healthcare services to anticipate changes in medical costs, or in construction indices to forecast project budgets and pricing pressures across the building sector.
Reference: Producer Price Index Home
Federal Funds Rate
Federal Funds Rate
Overview
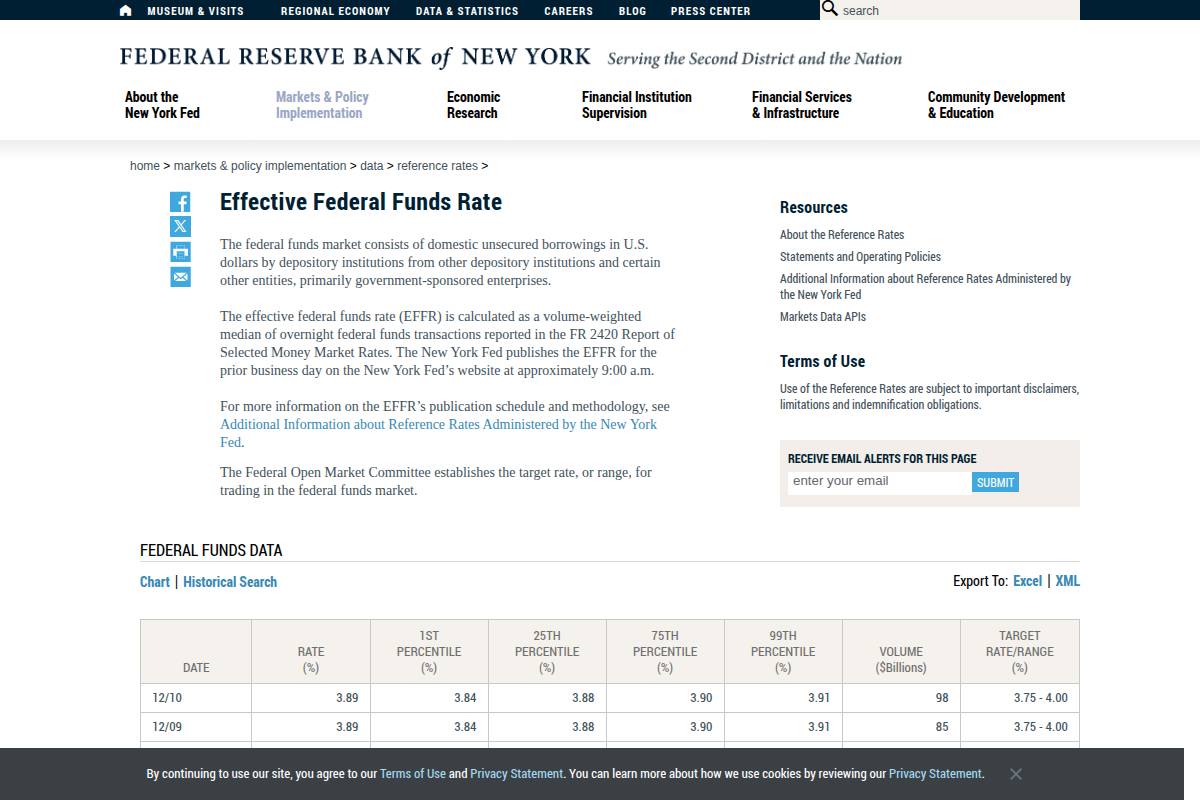
The federal funds rate is a core benchmark in the U.S. financial system. It represents the interest rate at which major commercial banks lend reserve balances to each other overnight, and is directly set by the Federal Reserve (Fed). This rate sets the tone for short-term interest rates across the economy.
For instance, when JPMorgan Chase borrows overnight funds from Wells Fargo to satisfy reserve requirements, they transact at the "fed funds rate." This system keeps sufficient liquidity within the U.S. banking sector.
Key Details
Decisions around setting the federal funds rate are made during meetings of the Federal Open Market Committee (FOMC). The FOMC convenes eight times a year, and rate decisions can immediately move financial markets.
For example, when the FOMC raised the target range to 5.00%–5.25% in May 2023, the S&P 500 index reacted with increased volatility, as investors rapidly recalibrated expectations for future economic growth and borrowing costs.
What Makes It Special
The federal funds rate is the primary tool employed by the Federal Reserve to implement U.S. monetary policy. Changes to this rate ripple throughout the financial system, impacting everything from consumer loans to corporate debt.
For example, when the Fed initiated a series of rate hikes in 2022, 30-year mortgage rates in the U.S. jumped above 7% for the first time in over 20 years, significantly increasing borrowing costs for American homebuyers.
Considerations
Investors closely watch the pace of changes in the federal funds rate, as rapid hikes or cuts can create significant volatility in both equity and fixed income markets. Sudden shifts often lead to sharp re-pricings of assets such as U.S. Treasury bonds and stock indexes.
During the global financial crisis in 2008, swift rate cuts attempted to stabilize markets, while the COVID-19 pandemic in March 2020 saw the Fed slashing rates to near-zero, triggering major moves in the Dow Jones Industrial Average and bond yields.
Best For
Retail investors and traders often use shifts in the federal funds rate to forecast broader market moves, particularly in stocks, bonds, and real estate. Rate hike cycles often signal risk-off sentiment, while lower rates can support bullish trends in growth-sensitive sectors like technology.
For example, the decline in rates through 2020 fueled a surge in the NASDAQ, as low borrowing costs spurred risk appetite and corporate investment.
Additional Info
To anticipate future moves, investors track each FOMC statement closely, reading for language hinting at potential rate hikes or cuts. Tools like the CME FedWatch Tool provide probabilities for future FOMC meetings based on futures pricing, guiding portfolio decisions for both traders and long-term investors.
The Fed’s published “dot plot,” which charts future rate expectations of committee members, is a key resource for anyone aiming to interpret the direction of U.S. monetary policy.
Reference: Effective Federal Funds Rate
Nonfarm Payrolls
Overview
The Nonfarm Payrolls (NFP) figure is a cornerstone statistic in labor market analysis. It measures the number of jobs gained or lost in the U.S. economy, deliberately excluding farm workers to avoid seasonal agricultural employment swings. NFP is integral to economists, investors, and policy makers when assessing economic health.
For instance, sharp NFP drops during March and April 2020 coincided with pandemic-induced shutdowns, signaling major contractions before GDP reports were published. By not counting farm work, domestic staff, or non-profit employees, the dataset focuses on sectors most sensitive to business cycles, like manufacturing and services.
Key Details
The Bureau of Labor Statistics (BLS) publishes the Nonfarm Payrolls data monthly, typically on the first Friday. It forms the headline number in the U.S. employment report, shaping expectations for everything from Federal Reserve decisions to stock market sentiment.
For example, when the February 2024 NFP report surprised with 275,000 new jobs—well above the consensus estimate—major U.S. indices like the S&P 500 rallied, reflecting renewed confidence in economic momentum.
What Makes It Special
NFP reports consistently cause sharp swings in financial markets. Traders in forex, equities, and bond markets attentively await its release, often positioning themselves based on expected outcomes. The report’s immediate impact can rival central bank statements or major economic crises.
On several occasions, such as the July 2022 release with over 500,000 jobs added, currency pairs like USD/INR and USD/EUR saw noticeable volatility within minutes, demonstrating its power as a market-moving event.
Considerations
One challenge with interpreting NFP is its volatility. The data is subject to substantial month-to-month fluctuations and frequent revisions by the BLS. This means initial headlines can mislead investors if later adjustments reverse trends.
For instance, in December 2023, the initial NFP print was revised downward by nearly 70,000 jobs a month later, altering the narrative of labor market strength. Managing risk around the event requires awareness of this potential for post-release changes.
Best For
Due to its immediate impact, NFP is particularly useful for traders seeking short-term opportunities or analyzing the current direction of the economy. Day traders in the U.S. and internationally often set up trades specifically timed to coincide with the NFP announcement due to the expected volatility.
Longer-term analysts, while paying attention, often blend NFP results with broader labor market data to account for frequent corrections and sector-specific anomalies.
Additional Info
Beyond job counts, savvy traders monitor wage growth figures within the NFP release. Rising average hourly earnings—a component reported alongside payrolls—hint at inflationary pressures. Closely watching changes to prior months’ payrolls can also catch shifting employment trends earlier than other economic statistics.
For example, when January 2023 wage growth topped expectations, it fueled speculation about upcoming Fed rate hikes, weighing on bond prices and boosting U.S. dollar demand worldwide.
Reference: Employment Situation Summary - 2025 M09 Results
Retail Sales
Retail Sales
Overview
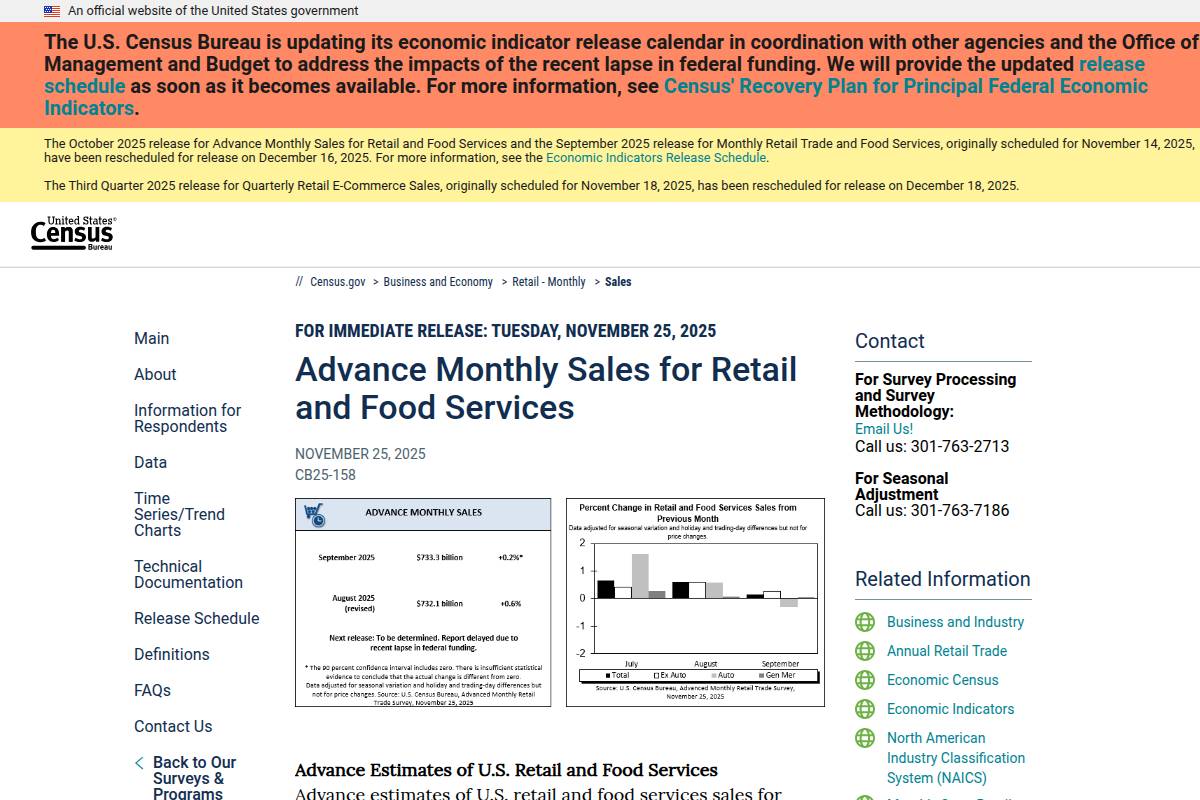
Retail Sales data serves as a crucial indicator for gauging the strength of consumer spending, reflecting monthly fluctuations in sales across a broad spectrum of U.S. retail outlets. As a widely followed economic metric, its release can drive significant market movements, especially in consumer-centric sectors.
For example, when the U.S. Census Bureau reported a 0.7% jump in retail sales for March 2024, major retailers like Walmart and Home Depot saw a noticeable uptick in their stock prices, signaling renewed investor confidence in consumer demand.
Key Details
The U.S. Census Bureau is responsible for compiling and releasing the Retail Sales report. Published around the middle of each month, it provides an advance estimate based on surveys representing various retail segments, from e-commerce to brick-and-mortar chains.
This data is keenly awaited by analysts and policymakers alike, as it arrives before other consumer spending statistics, allowing for early assessments of the broader economy’s direction.
What Makes It Special
Retail Sales distinguishes itself by providing nearly real-time insight into consumer behavior—often regarded as the engine of U.S. economic activity. Investors look to these numbers for signs of spending shifts that could foreshadow broader economic trends.
For instance, a sudden surge in electronics sales during a new iPhone launch can highlight discretionary spending strength, while a dip might signal weakening sentiment or purchasing power.
Considerations
While invaluable, Retail Sales data is known for its seasonality and susceptibility to distortions, especially around holiday periods like December. Retailers often experience large swings in sales volumes, which can complicate trend analysis.
For example, Amazon’s annual Prime Day in July can create a sharp, temporary spike in online sales, skewing that month’s numbers and making year-on-year or month-to-month comparisons trickier without adjustments.
Best For
This indicator is particularly useful for assessing consumer confidence and anticipating moves in cyclical sectors such as retail, travel, and leisure. Traders often react quickly to surprises in the data—an unexpected decline may prompt cautious positioning in retailers or restaurant chains, while positive surprises can prompt rallies in those same stocks.
A notable case: In November 2023, strong Black Friday and Cyber Monday results propelled shares of Target and Macy’s higher as investors saw improvement in sentiment and discretionary spending.
Additional Info
For investors seeking a clearer picture of underlying trends, the ‘core’ retail sales figure—which excludes volatile categories like autos and gasoline—offers more stable insights. This measure provides a filter against sector-specific anomalies that might not reflect broader demand.
For example, excluding auto sales mattered in February 2023, when supply chain bottlenecks temporarily depressed car dealer receipts even though other retail sectors displayed robust health.
Reference: Monthly Retail Trade - Sales Report
Housing Starts
Housing Starts
Overview
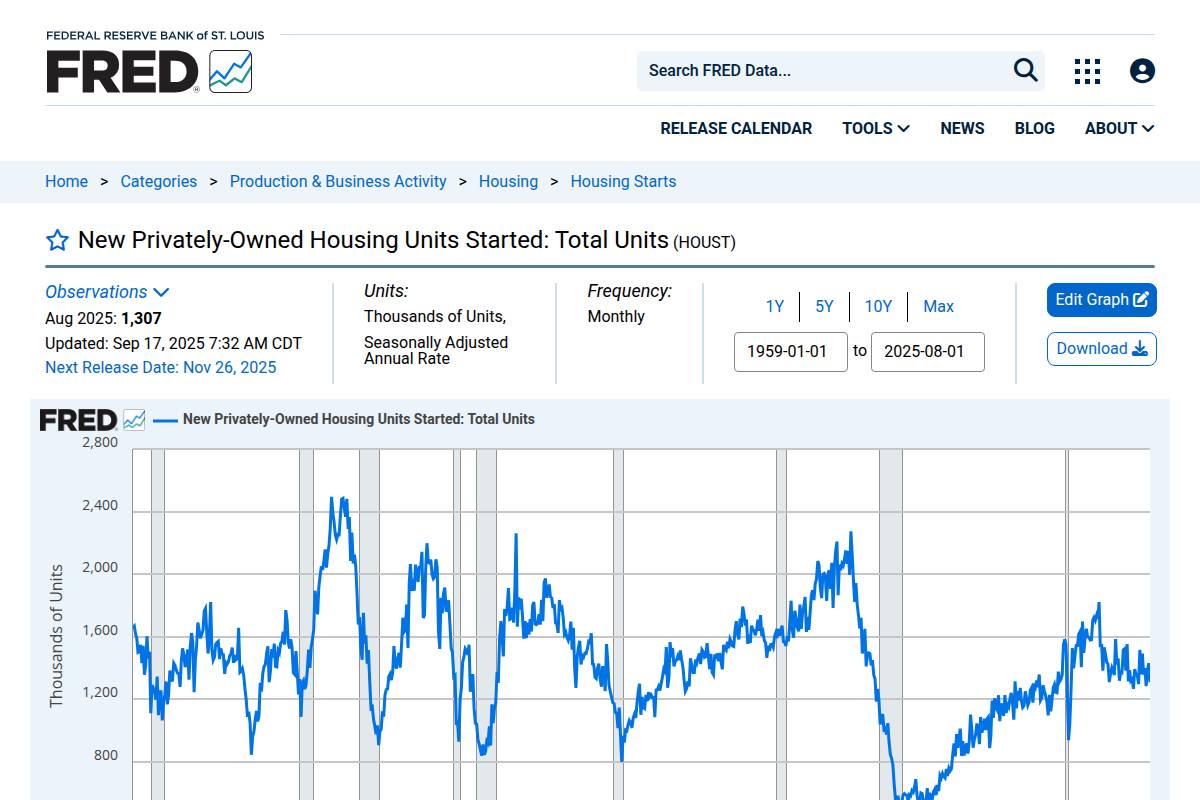
Housing starts serve as a barometer for the health of the construction and real estate industries. By tracking the number of new residential construction projects that commence each month, analysts gain insights into broader economic trends.
This metric doesn't merely reflect construction activity; it offers clues about consumer confidence and demand for housing. For example, during early 2023, housing starts in the United States rebounded to an annualized rate of 1.45 million units after earlier declines, indicating renewed optimism in the market.
Key Details
The U.S. Census Bureau is responsible for collecting and publishing housing starts data. Its monthly reports are closely monitored by economists, builders, and investors alike.
These data releases typically coincide with related indicators, such as building permits and completions, to offer a comprehensive view of the U.S. housing market's direction. For instance, the Census Bureau's New Residential Construction report provides historical comparisons, helping to contextualize current numbers.
What Makes It Special
Housing starts are especially sensitive to prevailing interest rates. When the Federal Reserve raises interest rates, borrowing costs for home builders increase, often leading to a decline in new projects.
This makes housing starts a valuable tool for gauging economic optimism. After the Federal Reserve cut rates in 2020, housing starts surged as low mortgage rates fueled buyer demand and builders reacted accordingly.
Considerations
Despite its value, housing starts can be volatile. Regional weather patterns, such as harsh winters in the Midwest or hurricanes in the Southeast, can cause monthly figures to swing dramatically.
For example, in February 2021, severe winter storms across Texas and neighboring states resulted in a nearly 10% drop in national housing starts compared to the prior month.
Best For
Investors and industry professionals use housing starts to forecast future supply and spot inflection points in the real estate cycle. A sudden uptick may signal growth opportunities for home builders like Lennar or D.R. Horton.
Retail investors often incorporate housing starts into research when considering exposure to construction materials stocks or REITs, anticipating trends before they show up in earnings results.
Additional Info
Housing starts are most informative when reviewed alongside building permits, which are also tracked by the U.S. Census Bureau. Building permits can precede or lag actual starts depending on regulatory and market factors, offering an early look at builder sentiment.
Combining starts and permits data provides a more robust forecast for future construction activity and helps clarify market direction for both short-term traders and long-term investors.
Reference: New Privately-Owned Housing Units Started: Total Units - FRED
ISM Manufacturing Index (PMI)
ISM Manufacturing Index (PMI)
Overview
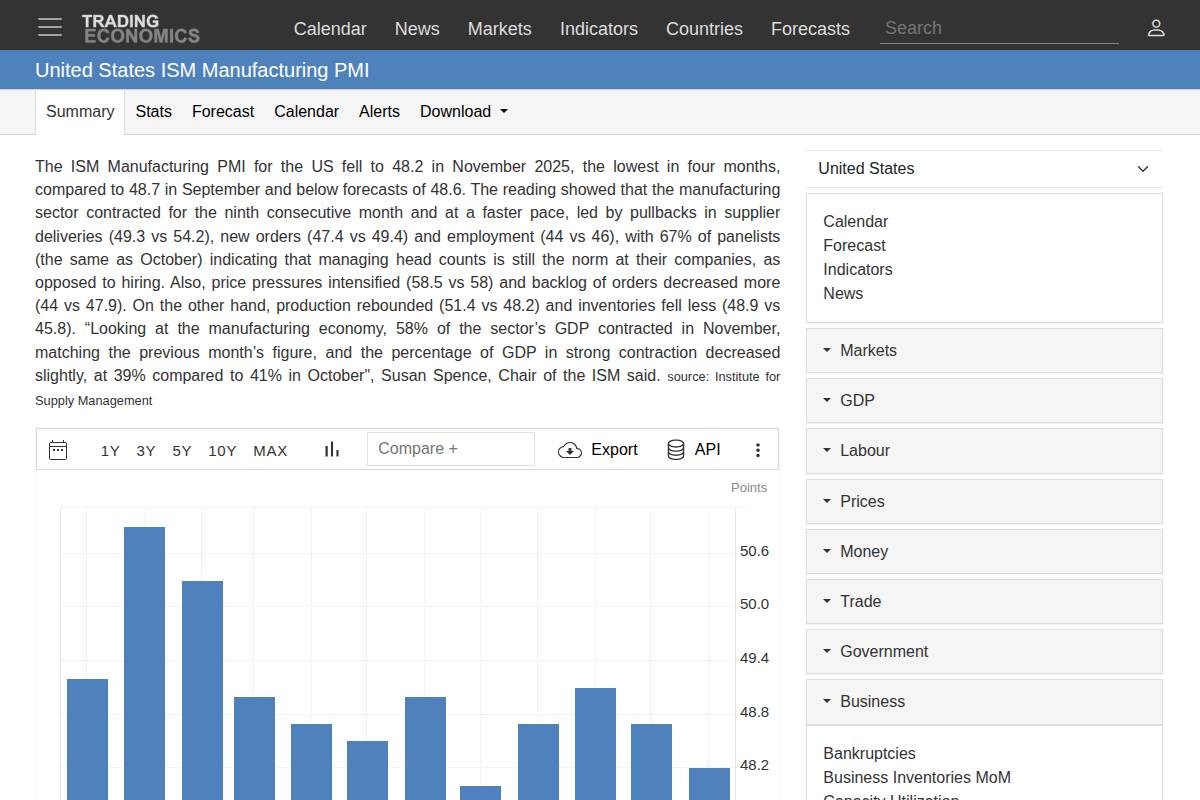
The ISM Manufacturing Index, often referred to as the PMI, serves as a crucial gauge of the economic health within the manufacturing sector of the United States. By surveying purchasing managers from various manufacturing firms, it produces a composite index that offers timely insights into business conditions.
This survey-based approach ensures that the index reflects real-time sentiment from professionals making sourcing and investment decisions. The ISM PMI is widely followed by investors and analysts as a leading indicator of overall economic activity, helping to shape market expectations and strategies.
Key Details
Published by the nonprofit Institute for Supply Management (ISM), the PMI report is released on the first business day of every month. It compiles feedback from purchasing and supply executives across industries, with the latest report summarizing conditions for the prior month.
For example, the ISM’s December 2023 Manufacturing PMI reflected a contraction, measuring at 46.2%. This immediate data release allows traders and investors to react quickly to emerging trends in the U.S. economy.
What Makes It Special
A defining feature of the ISM Manufacturing Index is its simple, intuitive scale: readings above 50 denote expansion in manufacturing activity, while readings below 50 signal contraction. This clear threshold makes the index actionable for both novice and experienced investors.
In March 2020, as COVID-19 disruptions hit supply chains, the ISM Manufacturing PMI plunged to 41.5, quickly alerting market participants to a severe downturn. Conversely, the swift recovery to 54.2 in July 2020 indicated an economic rebound. Such movements often precede major shifts in equity and bond markets.
Considerations
While the ISM Manufacturing Index offers valuable foresight, it only covers the manufacturing sector, which accounts for approximately 12% of the U.S. GDP according to the Bureau of Economic Analysis. As a result, its readings don’t always mirror the broader economy’s performance.
For instance, during periods of strong consumer services growth but weak manufacturing, the ISM PMI might suggest contraction even as gross domestic product continues to expand. Investors should supplement PMI insights with indicators from other sectors for a fuller picture.
Best For
The ISM Manufacturing Index is particularly valued for providing early signals of potential turning points in the economy. It delivers data before government-released economic figures, giving traders and analysts a crucial head start when timing market moves.
For example, many hedge funds closely track sudden changes in the PMI to adjust exposure to cyclicals versus defensives. Similarly, in the Indian market context, traders monitor global PMI trends to anticipate foreign inflows or shifts in market sentiment.
Additional Info
Internationally, the ISM Manufacturing Index is often referenced as the Purchasing Managers’ Index (PMI), though methods and organizations may vary by country. The U.S. ISM report is among the most closely watched, but similar indices exist for the UK, China, India, and the Eurozone.
For investors seeking a comparative edge, analyzing PMI figures across regions can reveal shifts in global manufacturing momentum, helping to identify attractive opportunities or lurking risks in various equity and currency markets.
Reference: United States ISM Manufacturing PMI
Consumer Confidence Index
Consumer Confidence Index
Overview
The Consumer Confidence Index (CCI) is a widely followed economic indicator that gauges how optimistic or pessimistic consumers feel about the health of the economy and their personal financial futures. Key market participants monitor this index as it can be a leading signal for economic growth or contraction.
The CCI synthesizes survey data regarding people's intentions to spend and save. In practical terms, when consumers are confident, they tend to spend more on discretionary items—fueling sectors like automobiles, electronics, and travel.
Key Details
The Conference Board, a global business research organization, publishes the Consumer Confidence Index every month. The reliability and timeliness provided by this source make it a trusted benchmark for both institutional and retail investors.
For example, the report released in March 2024 showed a reading of 104.7, indicating moderate optimism as compared to the previous month’s 103.4. Such monthly updates provide a continually refreshed barometer of public sentiment.
What Makes It Special
One of the CCI’s distinguishing traits is its strong correlation with actual consumer spending, which makes up two-thirds of US GDP. Shifts in the index often precede changes in retail sales and related stock prices.
During the sharp plunge in the CCI in April 2020—down to 85.7 from 118.8 in February—retail giants like Macy’s and Delta Air Lines saw dramatic declines in revenues, reflecting consumers’ sudden pullback in spending due to pandemic fears.
Considerations
While the CCI is influential, its readings can be quickly impacted by high-profile events or sudden news cycles. Major geopolitical shocks, elections, or headline-driven crises occasionally lead to steep, short-term changes in sentiment that may not persist.
For instance, a brief government shutdown or abrupt stock market selloff might temporarily dampen confidence, but such dips often recover within weeks if underlying economic fundamentals remain unchanged.
Best For
The CCI is particularly useful for investors aiming to anticipate inflection points in consumer-driven industries like retail, travel, and leisure. Detecting early shifts can help investors position portfolios ahead of broader market moves.
For example, after consumer confidence began rebounding in June 2021, hospitality companies such as Marriott International posted sequentially improving quarterly revenues as travel demand returned.
Additional Info
Delving into the CCI’s “present situation” and “expectations” sub-components offers deeper insight. The present situation index measures sentiment about current conditions, while expectations track consumer outlook for the next six months.
In December 2023, although the overall index ticked up, the "expectations" component flagged lingering uncertainty. In past cycles, a widening divergence between these components has been a precursor to economic slowdowns, providing an early cautionary signal to attentive investors.
Reference: US Consumer Confidence
How to Choose the Right Economic Indicators
Decision Guide
Making sense of the broad universe of economic indicators can be daunting, especially for those new to the world of investing. Each financial goal and investment style aligns better with certain types of economic data. Selecting the right metrics starts with understanding how these indicators connect to your portfolio decisions.
If your focus is equity markets, leading indicators such as the Purchasing Managers’ Index (PMI) or Consumer Confidence Index can help signal the direction of economic growth before it’s reflected in company earnings. For example, an uptick in the US PMI in June 2023 preceded a quarter in which the S&P 500 gained 8%, with tech giants like Microsoft and Apple outperforming.
Investors who target bonds or yield-generating assets often watch inflation metrics (such as the US Consumer Price Index) and interest rate decisions—like those from the Federal Reserve—since these directly influence bond yields. After the Fed raised the Federal Funds Rate to a 16-year high in July 2023, yields on 10-year Treasuries jumped above 4%, affecting income strategies across the market.
Comparison Tips
Relying on a combination of indicators helps reveal a more complete economic landscape. For instance, tracking both employment data and industrial production can help you better assess the sustainability of a market rally.
Monitoring how financial markets actually react to data releases is crucial. In March 2024, the US CPI release prompted a 1.2% dip in the NASDAQ within hours, illustrating how anticipation and actual results can diverge. Depending on your investment horizon, balancing leading indicators like new housing starts with lagging measures such as GDP growth ensures your analysis is both forward-looking and grounded in actual trends.
Stay Informed
Timely access to new economic data can make a significant difference in decision-making. Setting up custom calendars and alerts on platforms like Investing.com or Bloomberg Terminal enables you to track major releases relevant to your watchlist—be it RBI policy reviews for Indian equities or US Nonfarm Payrolls if you hold global exchange-traded funds.
Being proactive in receiving this information means you won’t be caught off guard by major shifts in the market. Many professional traders subscribe to government and exchange alert services, ensuring they’re among the first to know about critical developments that impact asset values.
Frequently Asked Questions
What is the most important economic indicator for investors?
Different investment approaches may emphasize certain economic indicators, but several key measures are nearly universal in their importance. Gross Domestic Product (GDP), Consumer Price Index (CPI), and the Federal Funds Rate are widely regarded as leading indicators for market trends.
For instance, when the U.S. Bureau of Economic Analysis reported a 4.9% annualized GDP growth rate in Q3 2023, market optimism increased, prompting rallies in indices like the S&P 500. The Federal Reserve's decisions to adjust the Federal Funds Rate, such as the 0.25% hike in July 2023, often have immediate impacts on stock and bond prices.
How often should I monitor economic data?
The frequency with which investors should track economic data depends on their investment style. Active investors, such as intraday or swing traders, often monitor indicators monthly or even more frequently to spot short-term market movements.
In contrast, long-term investors may find quarterly reviews sufficient, especially when using reports like earnings releases from companies like Reliance Industries or macroeconomic indicators. Platforms like Bloomberg and Investing.com provide real-time updates suited to both active and passive investors.
Are economic indicators always accurate predictors of markets?
No single indicator is a foolproof predictor of financial markets. It is essential to synthesize a range of signals and factor in market sentiment as well as real-world context.
For example, when U.S. CPI data showed higher-than-expected inflation in June 2022, the Nasdaq initially dropped. However, resilient job reports and dovish Fed comments soon buoyed the market. This shows why relying solely on one metric can lead to misinterpretation.
How can beginners start tracking economic indicators?
Getting started involves accessing reliable tools and using curated information sources. Subscribing to an economic calendar, such as those provided by Trading Economics or Economic Times Markets, is a practical first step. These calendars highlight scheduled releases and offer basic explanations.
Additionally, following updates from government sources like the U.S. Bureau of Economic Analysis demystifies underlying data. Beginners can also benefit from regular market summaries published by outlets such as CNBC or ET Now, which break down the impact of data releases on stocks, currencies, and commodities.
Do these indicators work for global markets too?
Nearly every major economy has its own set of tracked indicators, but many follow the same fundamental concepts found in U.S. reporting. For example, India's GDP is reported by the Ministry of Statistics and Programme Implementation, while Germany's CPI figures are tracked by Destatis.
Investors must adjust their data focus based on geographic context. If you trade Indian equities, you might watch RBI repo rate decisions or the IIP (Index of Industrial Production) just as closely as their U.S. equivalents. Major platforms like Yahoo Finance offer global economic calendar filters for country-specific insights.